


The indicator evaluates the degree of price variability and identifies the components leading to growth and fall. Using Variability, you can determine the places where the movement changes, successful moments for trading on the trend or against the trend. Accompany open transactions.
The indicator displays 3 lines:
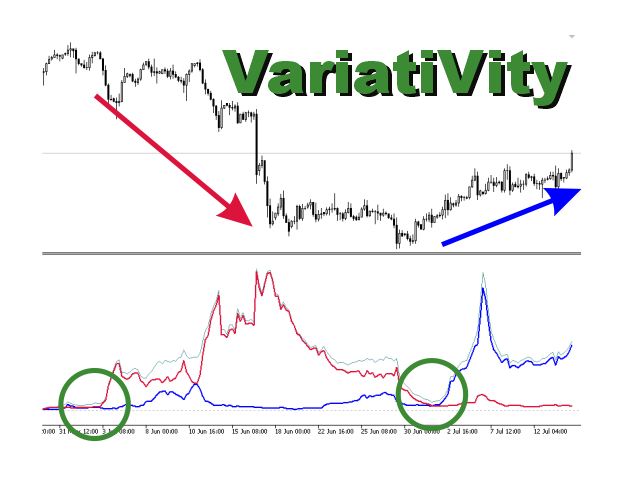
VARIABILITY – a thin gray line. Total price variability. The growth of the line indicates an increase in market activity. The decline shows the possibility of counter-trend trading. A significant drop to small values indicates a high probability of a trend reversal.
UP – the blue line. The percentage of changes leading to an increase in the exchange rate. The beginning of UP growth from small values, while reducing the overall variability, can serve as a signal for purchases.
DN – the fraction leading to a decrease. The share of changes leading to a decrease in the exchange rate.
The intersection of the UP and DN lines can also be used as an input signal.
Trend trading is performed at the beginning of the growth of the VARIABILITY line from small values. The direction is chosen based on the predominantly growing UP or DN
Counter-trend trading is performed when the VARIABILITY line decreases and the UP or DN begins to grow from small values
[spoiler title=”Read More…”]
It is recommended to carry out stop order trawls only when the overall volatility drops
Trend and sideways movement
A significant drop in VARIABILITY to the lows only precedes a possible trend change and may indicate the beginning of a sideways movement.
There is little variability in the lateral movement and it can persist for a long time.
Other recommendations
It is recommended to use the indicator in conjunction with range indicators (for example, ATR) and a trading schedule
When using timeframes from M30 to H4, it is necessary to carefully consider the daily cyclicity.
Take into account the specifics of the instrument when choosing a timeframe. For metals, it is recommended to use large timeframes H4,D1
The indicator is very simple in settings, it has only two main parameters:
PRICE – selection of the price for analysis. By default, the calculation is based on the opening prices of bars
DEPTH – the depth of the analyzed history. For practical purposes, it should be significant, at least 100 bars. By default, 240.
SMOOTH – smoothing of lines. It is disabled by default, but you can set the averaging period. 13 would be a good choice
The indicator performs a significant amount of calculations and for optimality, you can limit the number of calculated and displayed bars
LIMIT – if set, it limits the number of calculated bars
I wish you good luck !
The source code can be provided to the final buyer for review
The source code can be provided to the final buyer for review
[/spoiler]