


Many Forex traders assume that there is no such thing as volume in the foreign exchange market. And they will be right in their own way. No one has created a central exchange platform yet. And even if it was, what data about the volume could it provide?
We are dealing with trading activity, which is expressed in tick volume. After all, in the end, the volume is just a manifestation of the activity of buyers and sellers in the market. That is, to obtain volume data, an activity analysis is required, and vice versa-activity analysis requires volume data. Everything is simple. The Quantum Tick Volumes indicator takes the tick data of the MT4 platform and displays them on the chart in a convenient visual form.
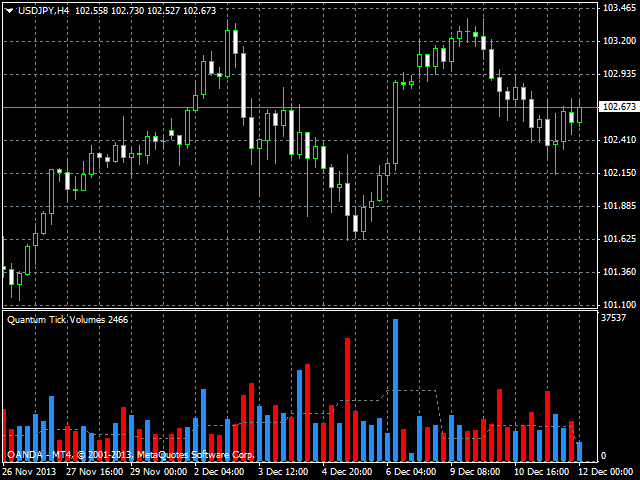
First, the indicator colors the volume bars using the colors of the candles on the candle chart. This means that you can quickly compare price and volume bars. When trading on the basis of volume and price, this is a necessity. The result of the analysis will depend on the speed of interpretation of the volume and price ratio.
Secondly, based on the daily data, the indicator plots a dynamic level on the chart, giving you an instant picture of the volume (high, medium or low) on the selected timeframe. Again, this is essential for a correct analysis of the price/volume dynamics. In addition, the volume, which is considered average during the London session, may be high for the Asian session. The dynamic level instantly reveals this, helping you to understand the highs and lows of each volume bar.
[spoiler title=”Read More…”]
Click here to learn how to configure the Quantum Tick Volumes indicator.
[/spoiler]