


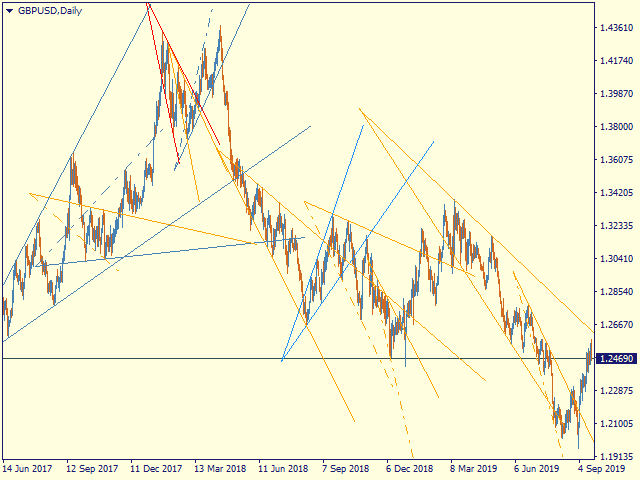

Automatic marking of the graph with Pentagram models.
This model is based on the Extension Model from the Tactics of the Advertiser. It is designed to determine the trend and predict possible levels and goals of price correction in the future.
The model describes a developing trend.
The trend is relevant as long as the price has not crossed the trend line of the model in the opposite direction.
The levels of the pentagram rays, the HP level, the distances of 100% and 200% of the distance between points 1-4, the HP level are possible levels of correction or the end of the trend.
If the HP level is consistently reached, a pullback to t4, t5, a trend line with a subsequent breakdown, it is expected that the target levels of tg1..tg5 will be consistently reached.
Parameters
–= indicator = — – general
ChartType–a way to build models-by Close or by High/Low (line chart or Japanese candlesticks)
MaxBarsToCalculate — the depth of the history for marking up models
Select New Model — select new models or not
Font size for price labels — font size for price labels at the model levels
Font size for point labels — font size for numbering model points
[spoiler title=”Read More…”]
–= Model’s Rules = — – setting model parameters
Bars for point 4 — the number of bars to fix the reference point 4
Enable 4′ in model — allow constructions on the tangent point 4
Minimal Base (1-3), bars — the minimum allowed size of the model base (the distance between points 1 and 3)
Maximum Model size (1-4) — the maximum allowed size of the model (the distance between points 1 and 4)
LT length in CP-4 — the length of the trend line on the chart in CP-4 units – the distance between the sacred and the 3rd points
Max distant CP from 1 in 1-3 — the maximum allowable removal of the sacred point, at which the model can still be considered expanding
–= Color Scheme = — – color scheme of models depending on the location in the trend
clrUpTrend — an ascending model from the beginning of the trend
clrDnTrend — a descending model from the beginning of the trend
clrUpCorrection–correction model
clrDnCorrection — –//–
clrUpContinuation–continuation model
clrDnContinuation — –//–
–= Graph Options = — – displaying levels
Always Show 100% 1-4 — 100% 1-4, the distance between points 1 and 4 of the model deferred from point 4
Show_Tg1_100 — 100% of the 1st goal
showTg3–Goal 3
showTg4–Goal 4
showTg5–Goal 5
–= Control bars = — – display of control points
showLinkBar, showBreakLT, showLastBar, showPiclose-experimental points, disabled by default
Managing the display and detail of models
You can select the model of interest by clicking the left mouse button
1st click-the model is highlighted with bold lines
2nd click-display of model details, price tags, control points
3rd click-remove the selection
Managing the display and detail of models
You can select the model of interest by clicking the left mouse button
1st click-the model is highlighted with bold lines
2nd click-display of model details, price tags, control points
3rd click-remove the selection
Keyboard shortcuts
S–hide / show models, except for the selected ones
> > – select the following model
< – select the previous model
ESC–cancel all selections
[/spoiler]