


“Follow the market’s desire.”
The indicator shows the” Desire ” (effort) of the market on the current and senior timeframe (TF), indicates current and confirmed goals, determines and shows the resistance (Res) and support (Sup) lines of the current and/or senior TF.
The” Desire “of the TF does not always coincide with the possibility (real price movement), but the confirmed goal is always achieved in the next “lives”. The TF located nearby are not always unanimous in their “Desire”. Each TF lives its own life and often its “Desire” is directly opposite to the” Desire ” of neighboring TF.
“Desire” is born, develops, reaches the limit, shows the goal to which it aspired, and, passively fading, is reborn into its opposite, or, continuing to develop, expands. In the process of developing “Desire”, three levels of Res and three levels of Sup are manifested. For each TF, they are different both in numbers and in importance. Of the 6 TF levels, the most significant are Sup1, Res1 (limits) and Sup3 and Res3 (bases).
The published indicator was developed as a result of long-term research in order to introduce quantitative indicators into the wave theory that would unambiguously determine the type and belonging of the wave of a particular TF.
As a result of long-term (more than 10 years) work in the real market, it has confirmed its reliability, revealed many patterns and exceptions, acquired a large number of additional dimensions and at the same time showed the high complexity and importance of the relationships of all TF, from the smallest M1 to the highest MN1. These extensions are included in the professional version of the indicator, which will be offered in the future, if there is interest.
[spoiler title=”Read More…”]
The most effective way to use the indicator is to install it in three windows of the same instrument with different periods. For example, 5, 30, 240 or 15, 60, 240, etc. The zero bar of the current TF is calculated on each new bar of the lower TF.
- Bar – The number of bars to be drawn;
- slow – Doubling the current TF, useful for small TF;
- TF_high-Displays the resistance and support lines of the older TF. The lines of the older TF end further than the current one. It is not updated in the tester;
- Line-Display of the resistance and support lines of the current TF;
- zz-Connecting the vertices of the current TF with lines;
- up, up_up, dn, dn_dn – Colors of the resistance and support lines (Sup1, Sup3, Res1, Res3).
The color of the lines in the indicator is preset for the “Green On Black” color scheme.
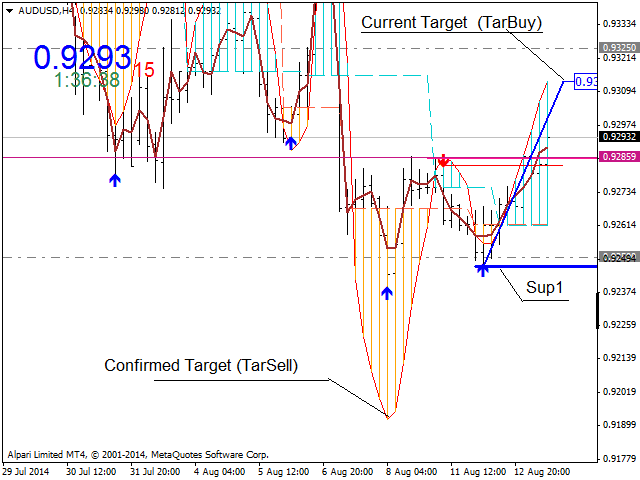
Explanation of the screenshots: unfortunately, the size of the screenshots does not give a complete picture of the state of the market on the current TF.
Explanation of the screenshots: unfortunately, the size of the screenshots does not give a complete picture of the state of the market on the current TF.
[/spoiler]