


The ADR ST Patterns Strategy indicator is a modification of the classic ADR indicator. This simple indicator corresponds to the parameters of the ST Patterns Strategy (). Structural Target Patterns are essentially the market itself, sequentially divided into components. To form ST Patterns, you do not need trend lines, geometric proportions of the model itself, trading volume, or open market interest. They are easily recognized and are built only on the basis of the fact of breaking through the fractal levels and the distance to the target. ST Patterns remove the uncertainty inherent in previously known graphic compositions from the market and simplify the trader’s work.
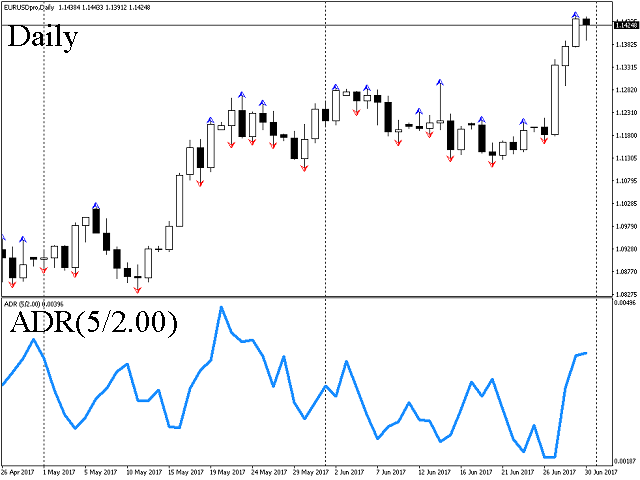
The ADR ST Patterns Strategy indicator calculates the average daily range of completed trading days and divides this value by the specified value. The result is displayed as a graph in a separate window. It is possible to use the indicator on various time charts.
- ADR Period – the number of days to calculate the average value;
- Divider – the divider by which the resulting average value is divided.
On the Colors tab, you can adjust the color and size of the graph.